 Owncast ahora soporta plugins personalizados.
 Rendimiento del flujo
Salud general del flujo
No tiene sentido transmitir si nadie puede verlo. The Stream Performance page in the admin, at /admin/stream-health, gives you an overview of some important metrics that may give you an idea if what you’re offering your viewers is leading to a good experience.
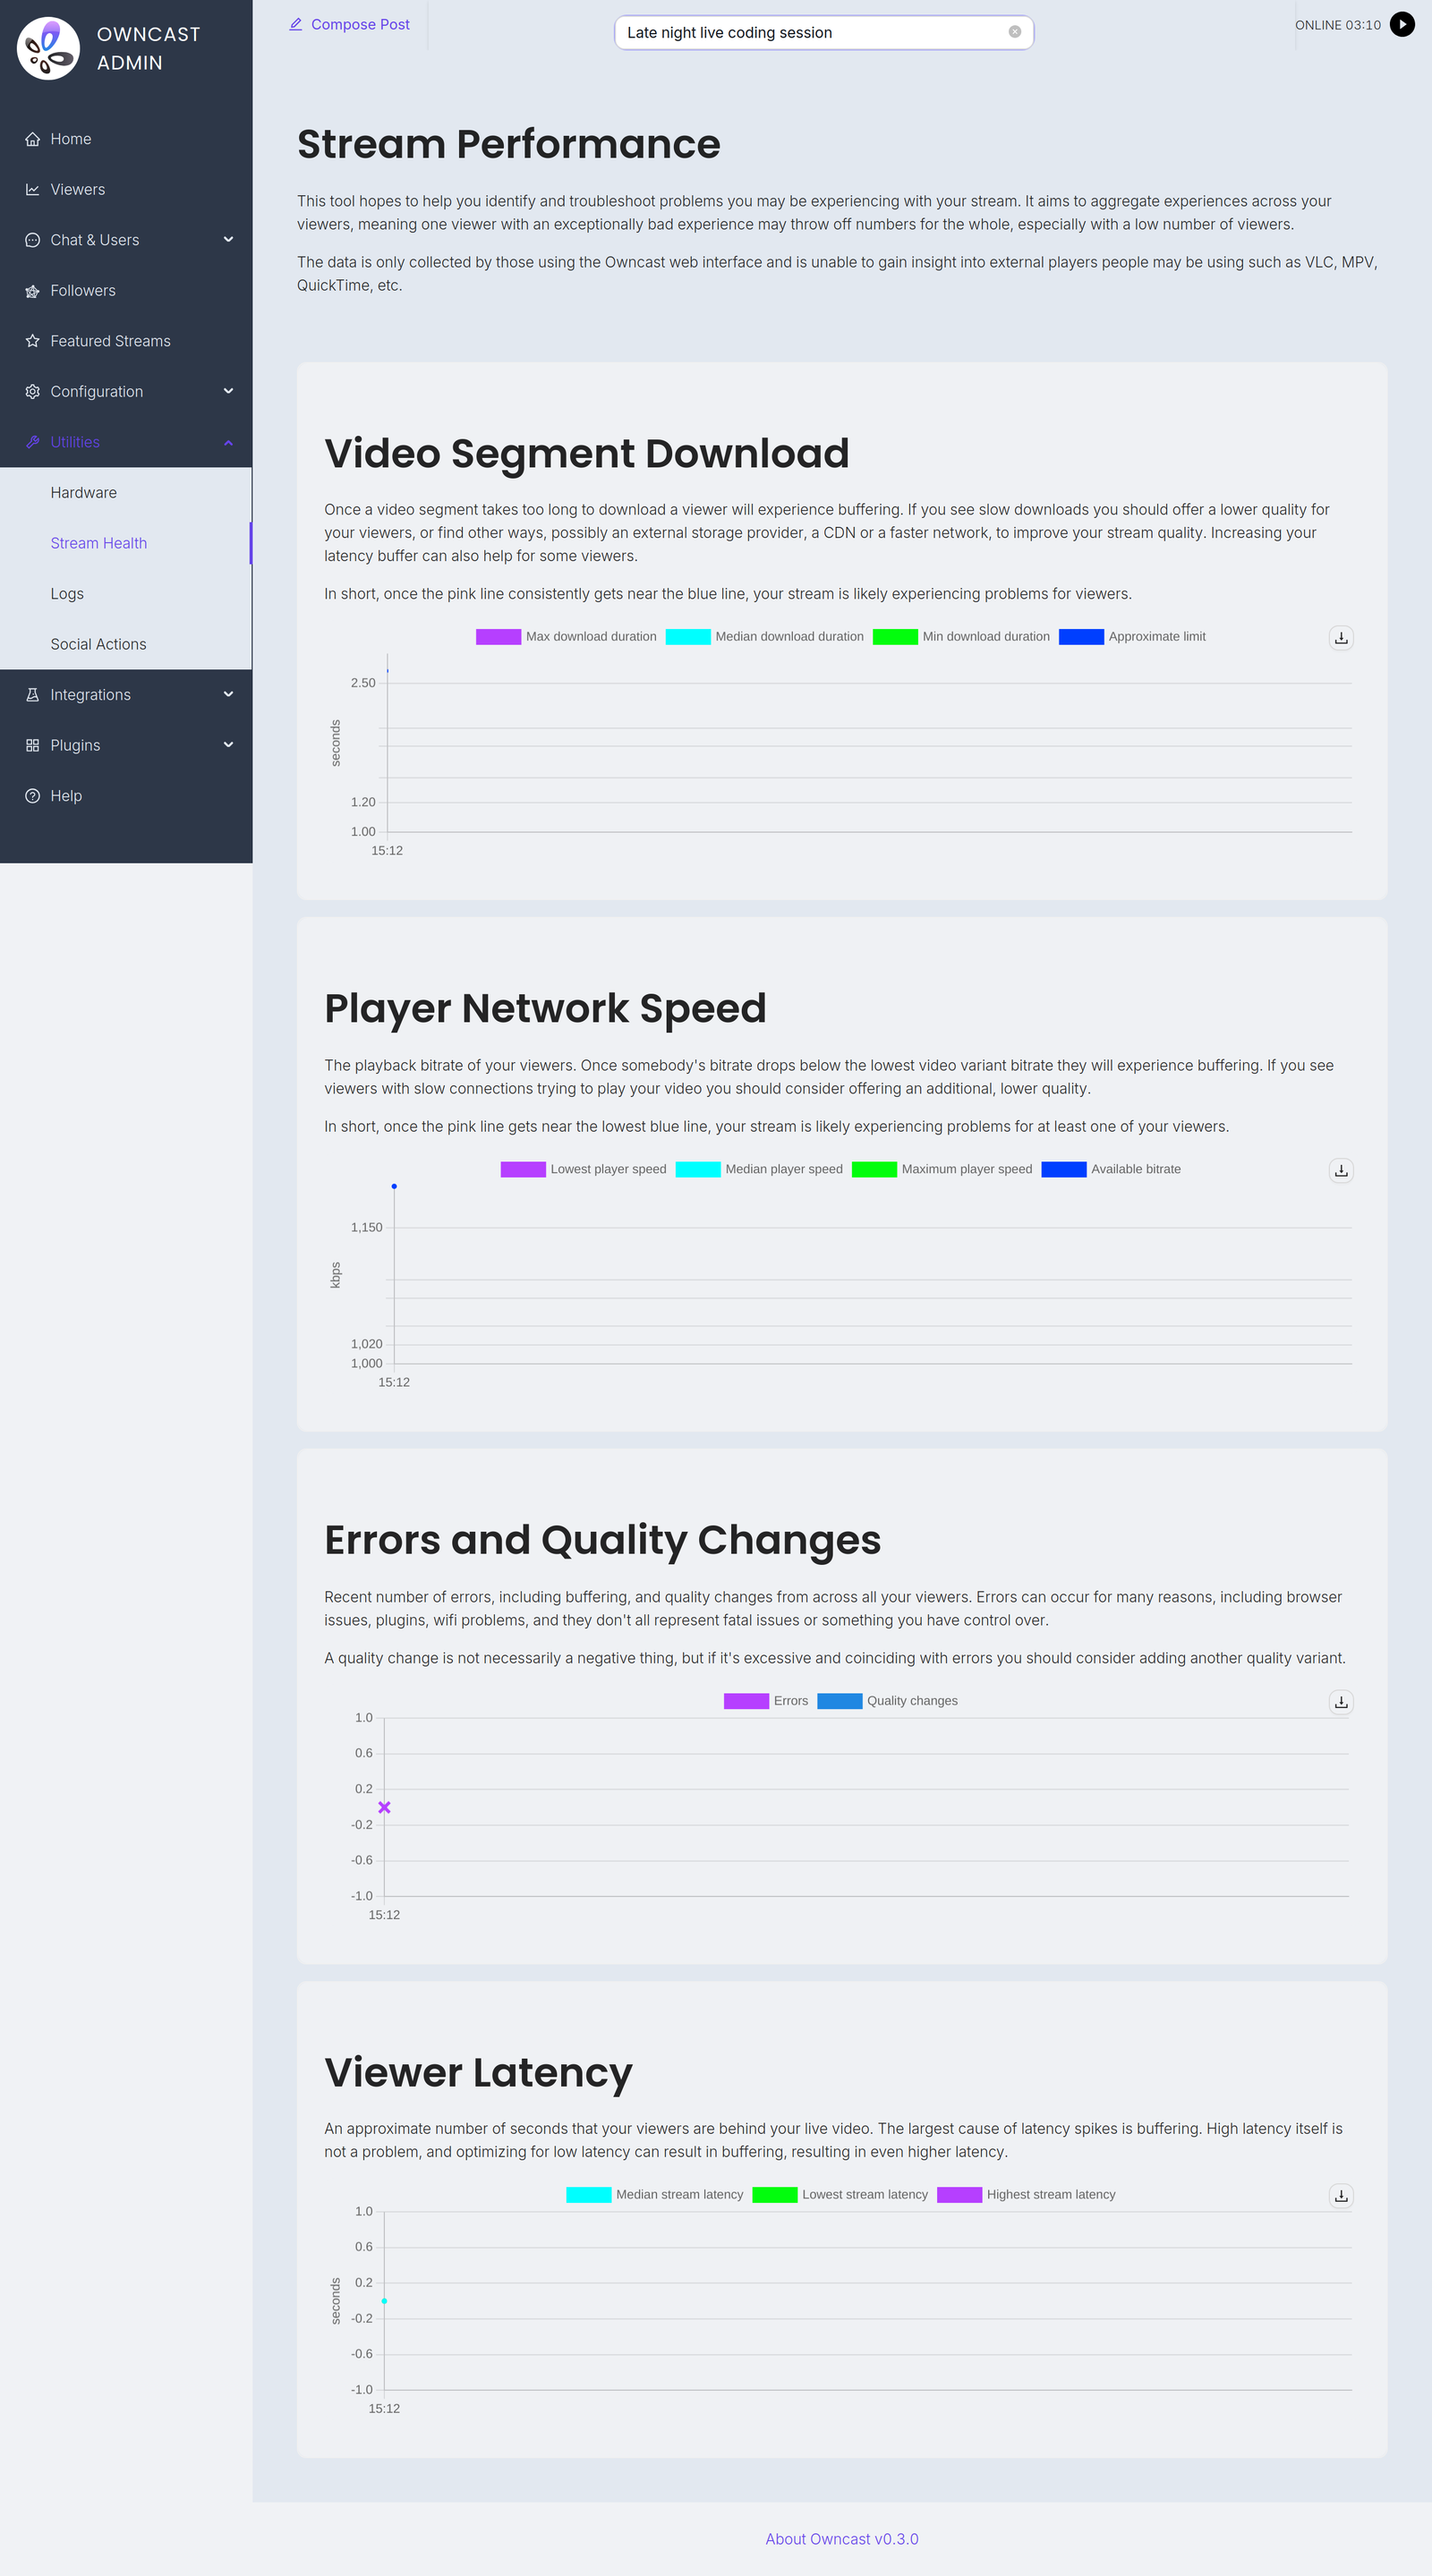
The page charts four things: Video Segment Download, Player Network Speed, Errors and Quality Changes, and Viewer Latency.
Ver errores, bajas velocidades de red y tiempos de descarga excesivos para su contenido puede significar que necesita añadir calidades de video adicionales para mejorar el rendimiento de la reproducción para espectadores con menor ancho de banda, redes móviles u otros factores.
Si ve en esta página que las personas están experimentando problemas para reproducir su transmisión, puede que desee solucionar problemas.
Note: Only some players report detailed playback metrics themselves, mostly web browsers running the Owncast web interface.
For players that do not self-report, such as VLC, mpv, Safari and ffmpeg, Owncast records the download speed and duration of video segments it serves, as observed by the server. This only works when Owncast serves the video itself. If your segments are hosted on S3 storage, viewers download them from there and these players are not represented in the metrics.
Hardware
Saber cómo está rindiendo tu CPU, en particular, respecto a las tareas de procesamiento de video es importante al solucionar problemas. Owncast te ofrece una visión general de las métricas clave del hardware para ayudar con esto.
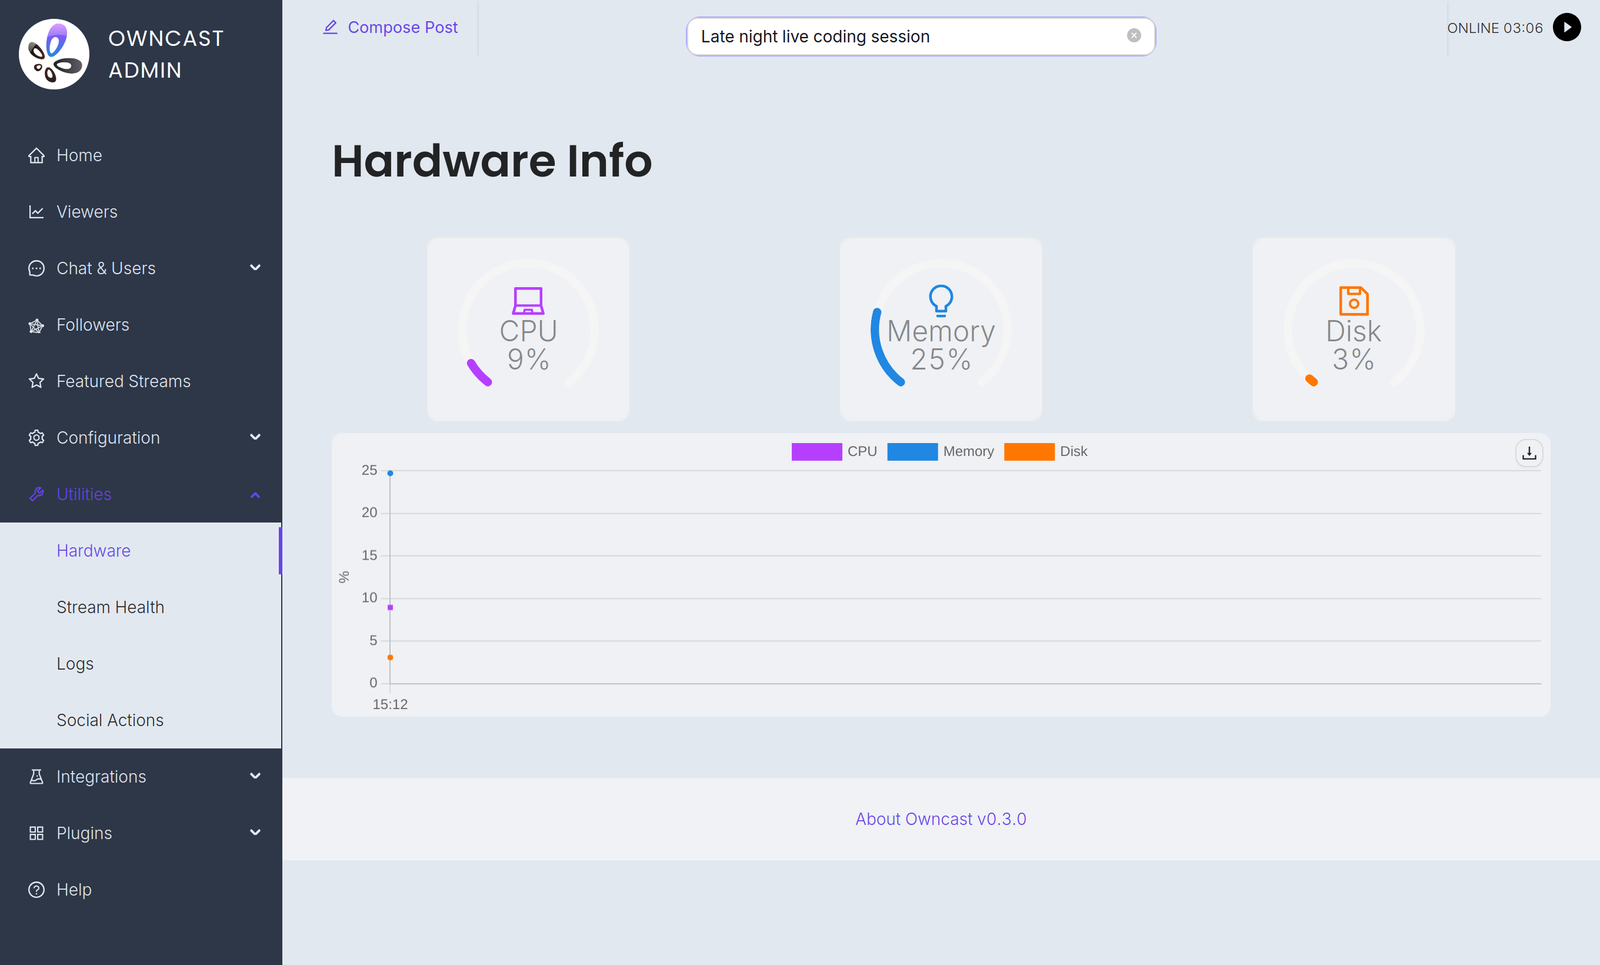
Si ves que tu hardware está siendo sobreutilizado, es posible que desees solucionar problemas.
Prometheus
Para las personas que prefieren usar soluciones de monitoreo externas, Owncast admite el uso de Prometheus para recopilar un conjunto de métricas.
Puedes señalar tu configuración de Prometheus a tu instancia de Owncast con el punto final /api/admin/prometheus, usando autenticación básica y los datos de inicio de sesión del administrador.
Por ejemplo:
- job_name: owncast
  scrape_interval: 1m
  metrics_path: /api/admin/prometheus
  scheme: https
  basic_auth:
    username: admin
    password: my_admin_password
  static_configs:
    - targets: ["my.owncast.server"]
Exported metrics
All series are gauges, and all carry two constant labels: version (the Owncast version) and host (your configured server URL, or unknown if it isn't set).
| Name | Meaning |
|---|---|
owncast_instance_active_viewer_count | The number of current viewers. |
owncast_instance_active_chat_client_count | The number of connected chat clients. |
owncast_instance_total_chat_users | The total number of chat users on this Owncast instance. |
owncast_instance_current_chat_message_count | The number of chat messages currently saved before cleanup. |
owncast_instance_playback_error_count | Errors reported by players within the current collection window. |
owncast_instance_cpu_usage | CPU usage as seen internally by Owncast. |
Owncast refreshes these values every 2 minutes, so scraping more frequently than that won't give you more resolution.
Improve this page
See something missing or incorrect? Edit the English version of this page or help improve translations.
 Gabe Kangas