 Owncast ora supporta plugin personalizzati.
 Prestazioni dello stream
Salute generale dello stream
Non ha senso trasmettere se nessuno può vederlo. The Stream Performance page in the admin, at /admin/stream-health, gives you an overview of some important metrics that may give you an idea if what you’re offering your viewers is leading to a good experience.
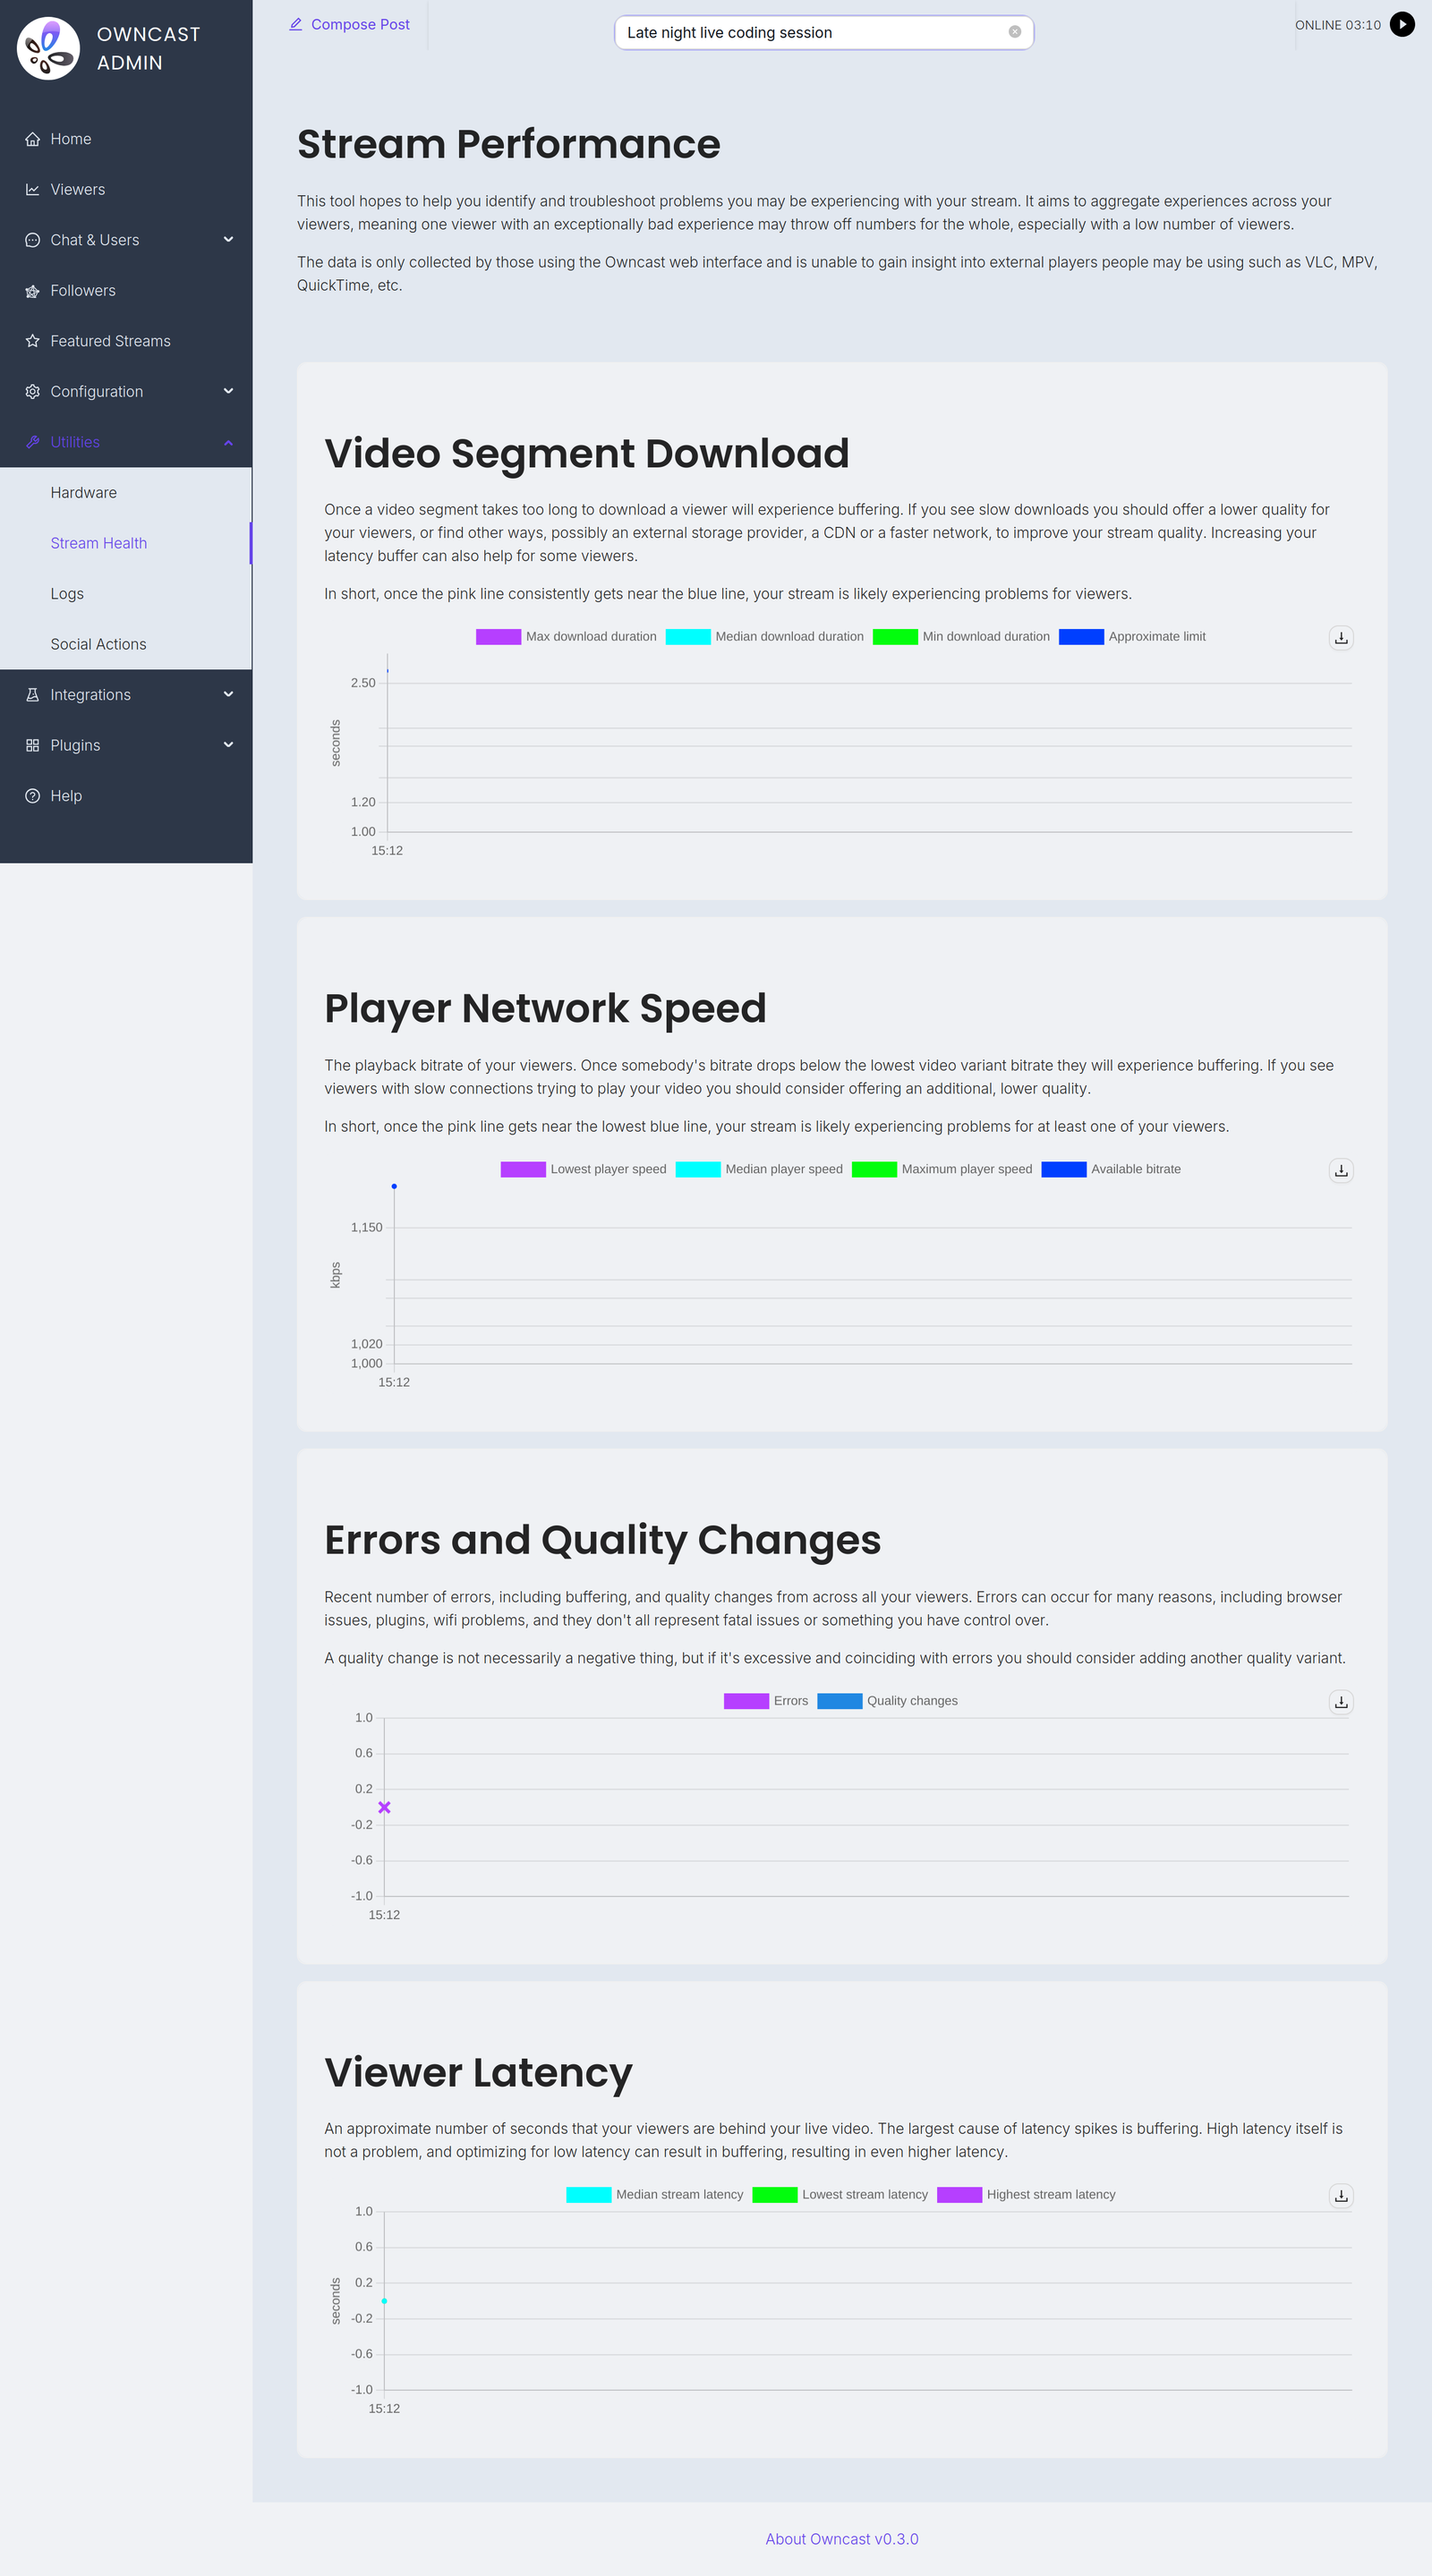
The page charts four things: Video Segment Download, Player Network Speed, Errors and Quality Changes, and Viewer Latency.
Vedere errori, basse velocità di rete e tempi di download eccessivi per il tuo contenuto potrebbe significare che devi aggiungere ulteriori qualità video per migliorare le prestazioni di riproduzione per spettatori a bassa larghezza di banda, reti mobili o altri fattori.
Se vedi in questa pagina che le persone stanno riscontrando problemi nella riproduzione del tuo stream, potresti voler risolvere i problemi.
Note: Only some players report detailed playback metrics themselves, mostly web browsers running the Owncast web interface.
For players that do not self-report, such as VLC, mpv, Safari and ffmpeg, Owncast records the download speed and duration of video segments it serves, as observed by the server. This only works when Owncast serves the video itself. If your segments are hosted on S3 storage, viewers download them from there and these players are not represented in the metrics.
Hardware
È importante sapere come il tuo CPU, in particolare, riesce a gestire i compiti di elaborazione video durante la risoluzione dei problemi. Owncast ti fornisce una panoramica ad alto livello delle metriche hardware chiave per aiutarti in questo.
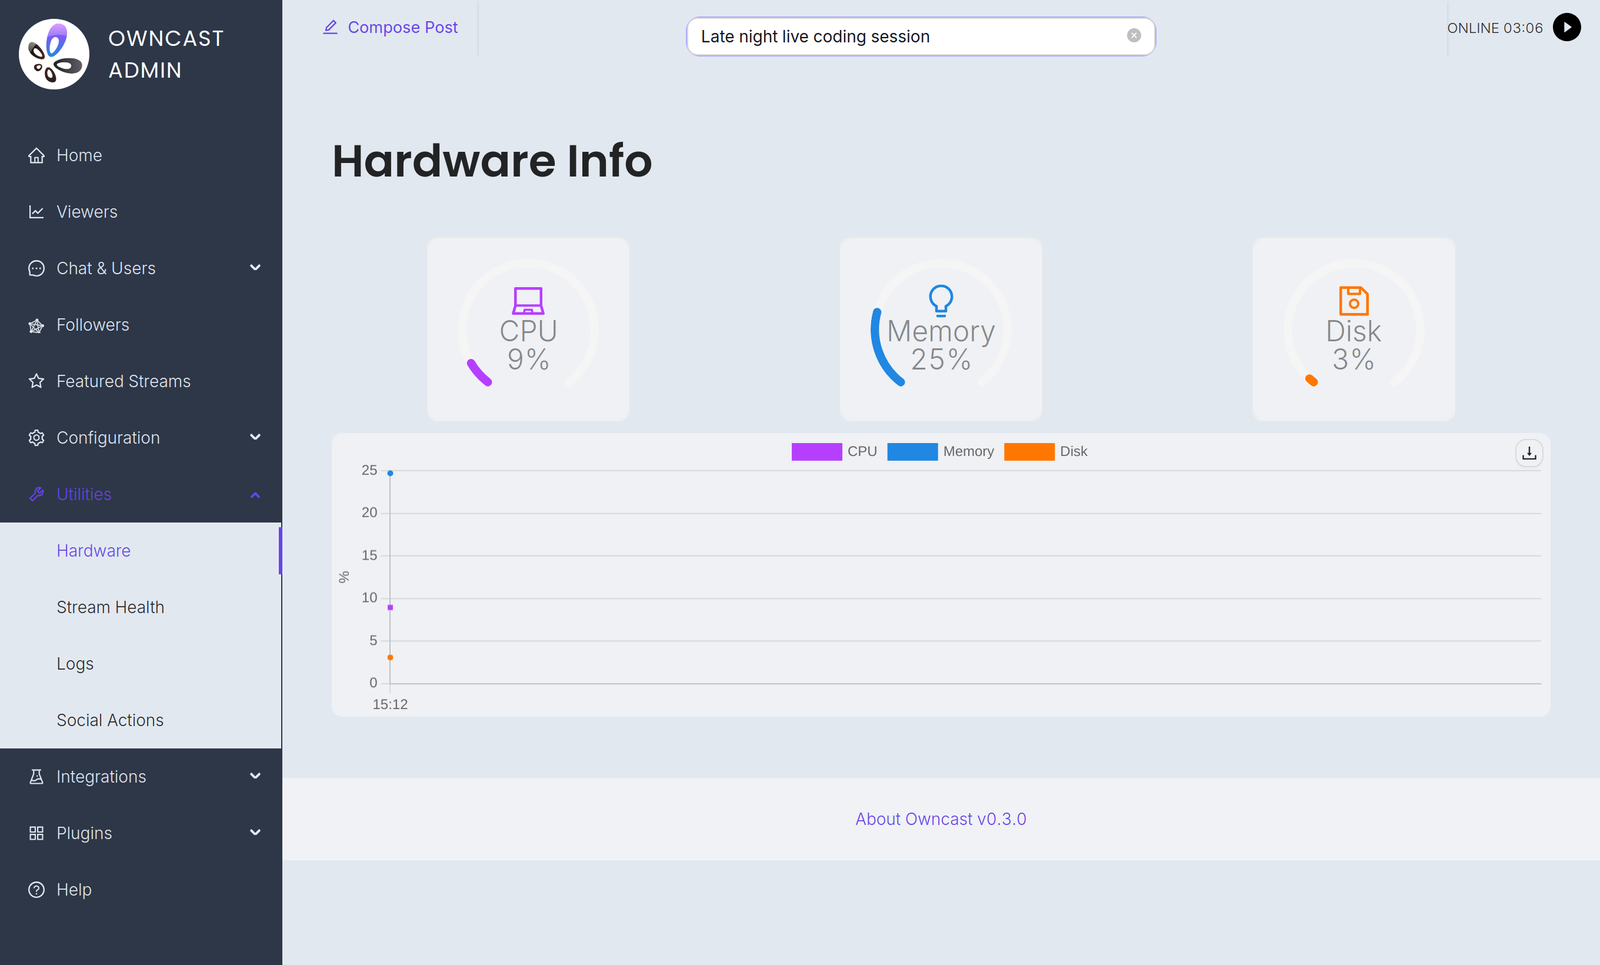
Se vedi che il tuo hardware è sovrautilizzato, potresti voler risolvere i problemi.
Prometheus
Per le persone che preferiscono utilizzare soluzioni di monitoraggio esterne, Owncast supporta l'utilizzo di Prometheus per raccogliere un insieme di metriche.
Puoi puntare la tua configurazione di Prometheus alla tua istanza di Owncast all'endpoint di /api/admin/prometheus, utilizzando l'autenticazione di base e i dati di accesso dell'amministratore.
Ad esempio:
- job_name: owncast
  scrape_interval: 1m
  metrics_path: /api/admin/prometheus
  scheme: https
  basic_auth:
    username: admin
    password: my_admin_password
  static_configs:
    - targets: ["my.owncast.server"]
Exported metrics
All series are gauges, and all carry two constant labels: version (the Owncast version) and host (your configured server URL, or unknown if it isn't set).
| Name | Meaning |
|---|---|
owncast_instance_active_viewer_count | The number of current viewers. |
owncast_instance_active_chat_client_count | The number of connected chat clients. |
owncast_instance_total_chat_users | The total number of chat users on this Owncast instance. |
owncast_instance_current_chat_message_count | The number of chat messages currently saved before cleanup. |
owncast_instance_playback_error_count | Errors reported by players within the current collection window. |
owncast_instance_cpu_usage | CPU usage as seen internally by Owncast. |
Owncast refreshes these values every 2 minutes, so scraping more frequently than that won't give you more resolution.
Improve this page
See something missing or incorrect? Edit this page and improve the documentation for everyone.
 Gabe Kangas