 Owncast agora suporta plugins customizados.
 Desempenho do stream
Saúde geral do stream
Não há sentido em transmitir se ninguém puder assistir. The Stream Performance page in the admin, at /admin/stream-health, gives you an overview of some important metrics that may give you an idea if what you’re offering your viewers is leading to a good experience.
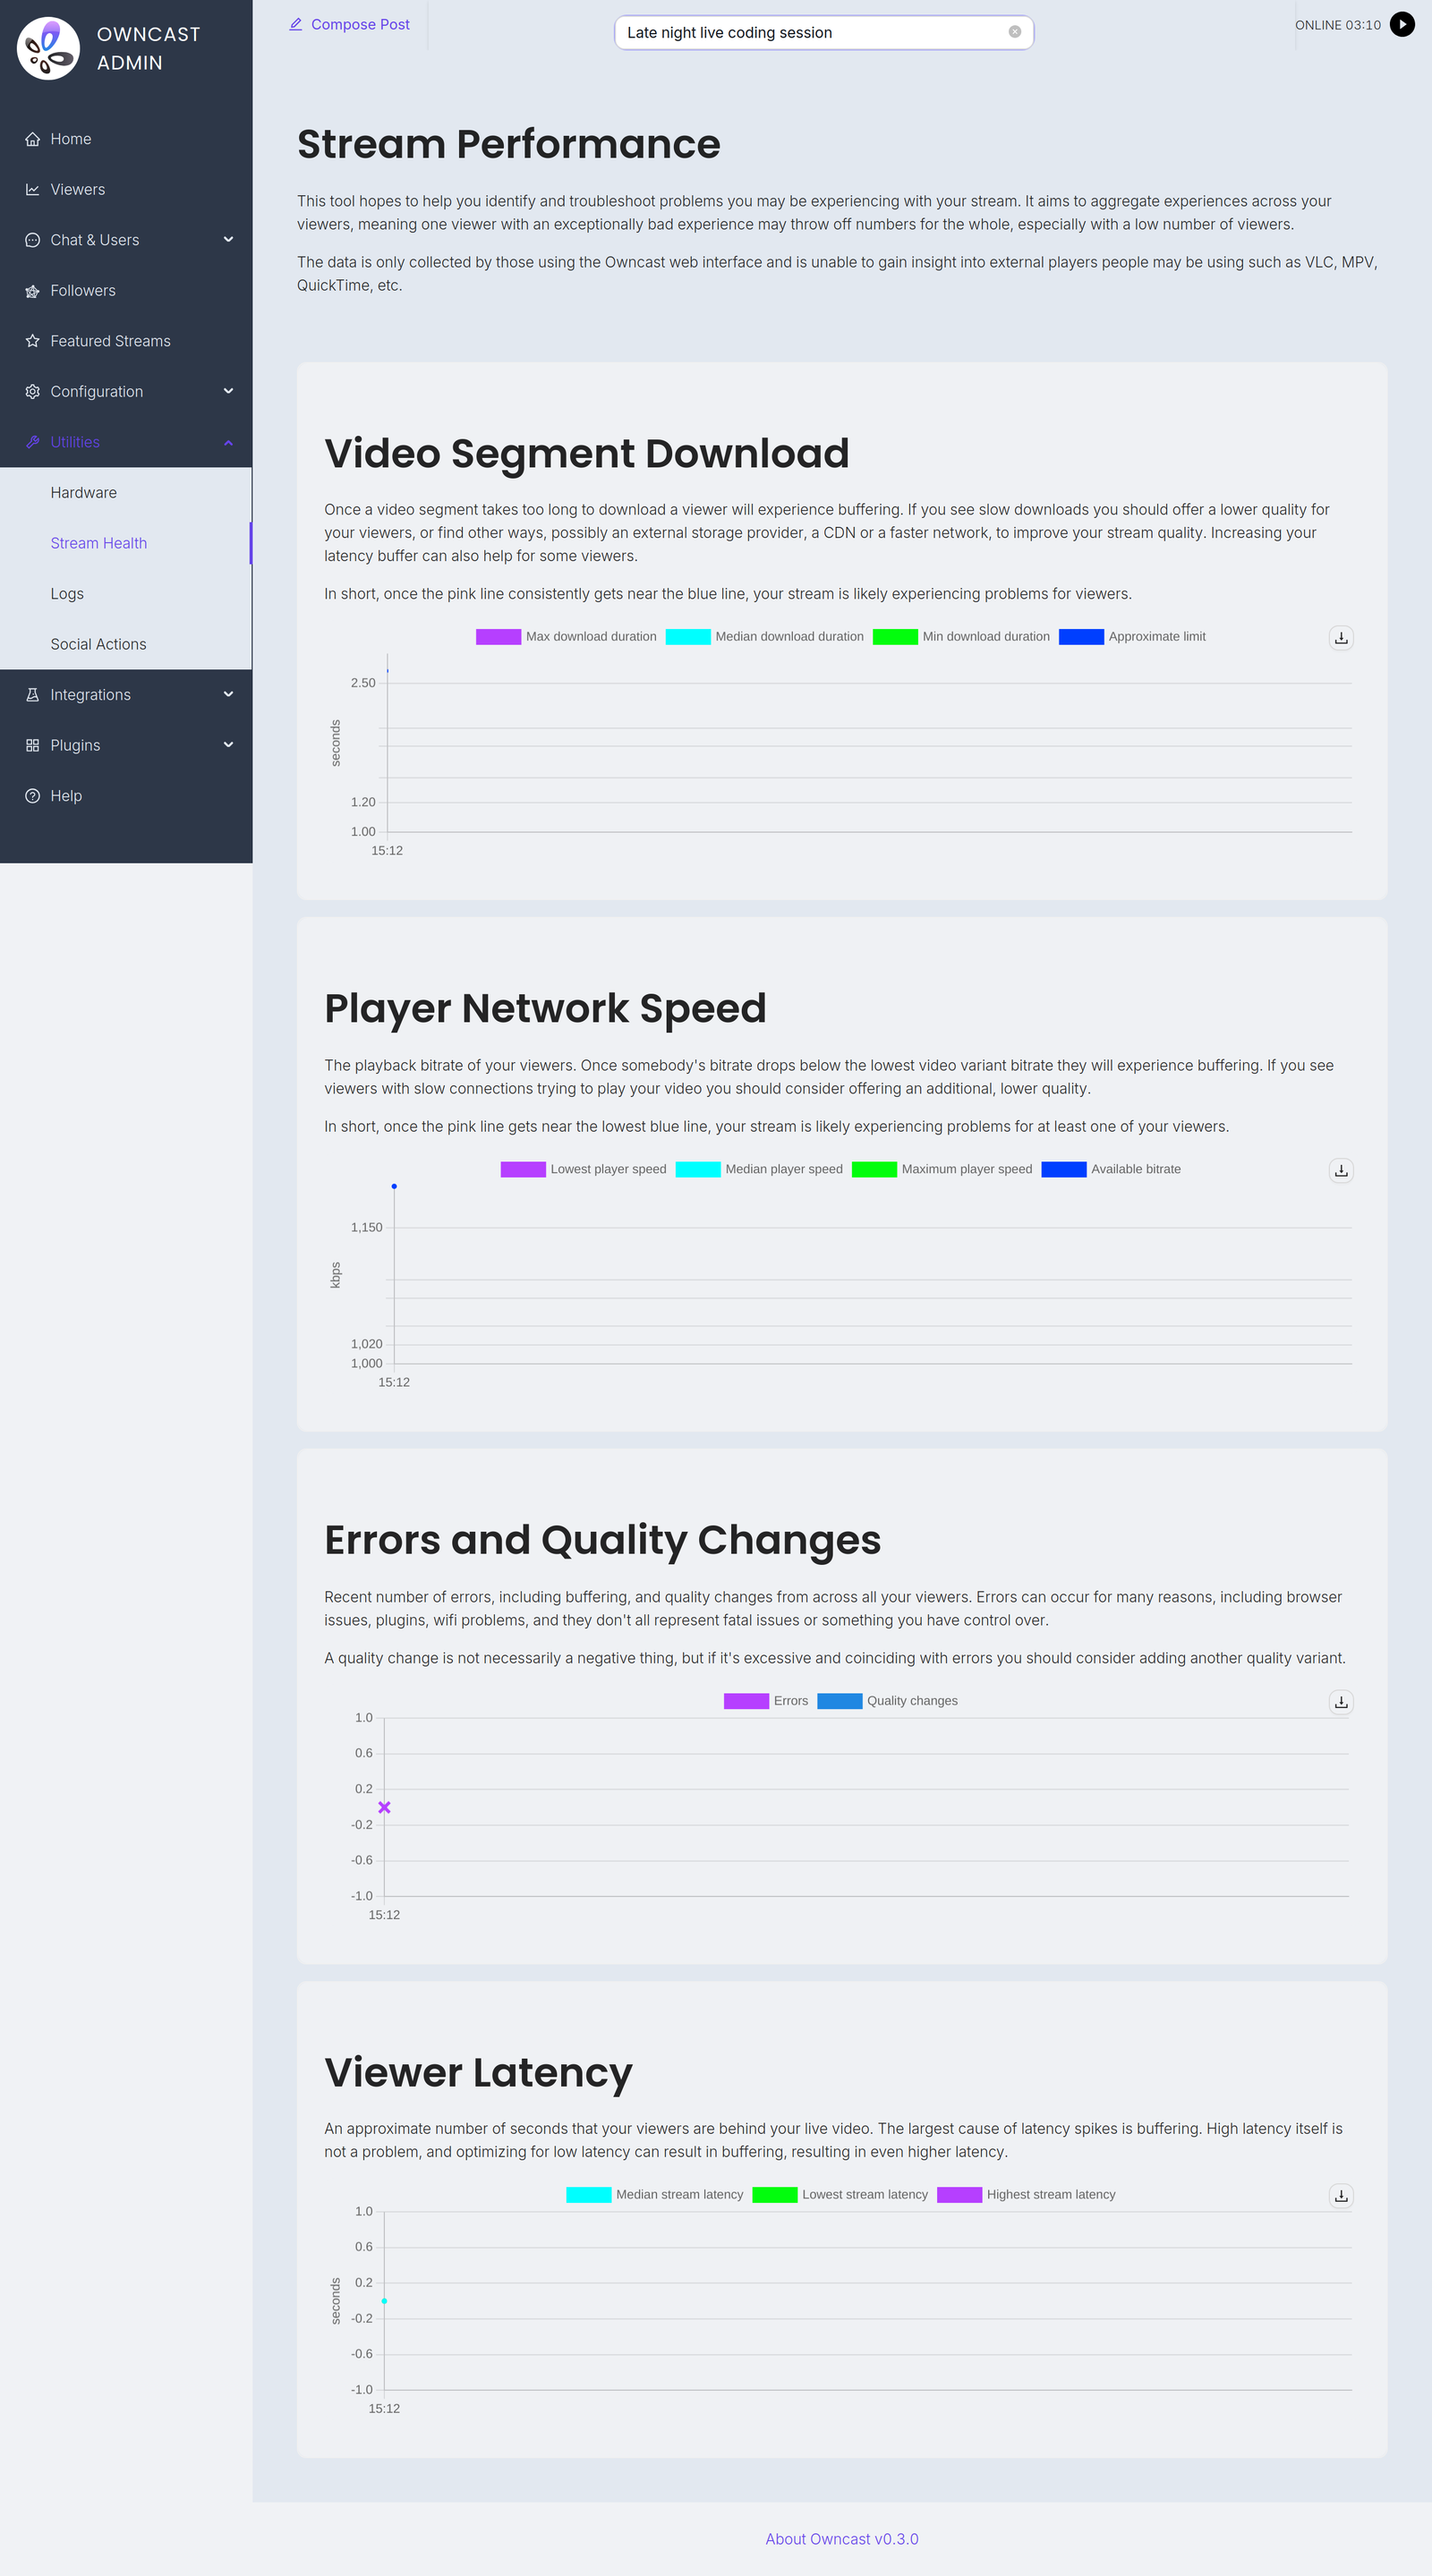
The page charts four things: Video Segment Download, Player Network Speed, Errors and Quality Changes, and Viewer Latency.
Ver erros, baixas velocidades de rede e tempos de download excessivos para seu conteúdo pode significar que você precisa adicionar qualidades de vídeo adicionais para melhorar o desempenho da reprodução para espectadores com largura de banda mais baixa, redes móveis ou outros fatores.
Se você está vendo nesta página que as pessoas estão enfrentando problemas na reprodução do seu stream, talvez você queira resolver problemas.
Note: Only some players report detailed playback metrics themselves, mostly web browsers running the Owncast web interface.
For players that do not self-report, such as VLC, mpv, Safari and ffmpeg, Owncast records the download speed and duration of video segments it serves, as observed by the server. This only works when Owncast serves the video itself. If your segments are hosted on S3 storage, viewers download them from there and these players are not represented in the metrics.
Hardware
Saber como sua CPU, em particular, está lidando com as tarefas de processamento de vídeo é importante ao solucionar problemas. O Owncast fornece uma visão geral de alto nível das métricas de hardware-chave para ajudar com isso.
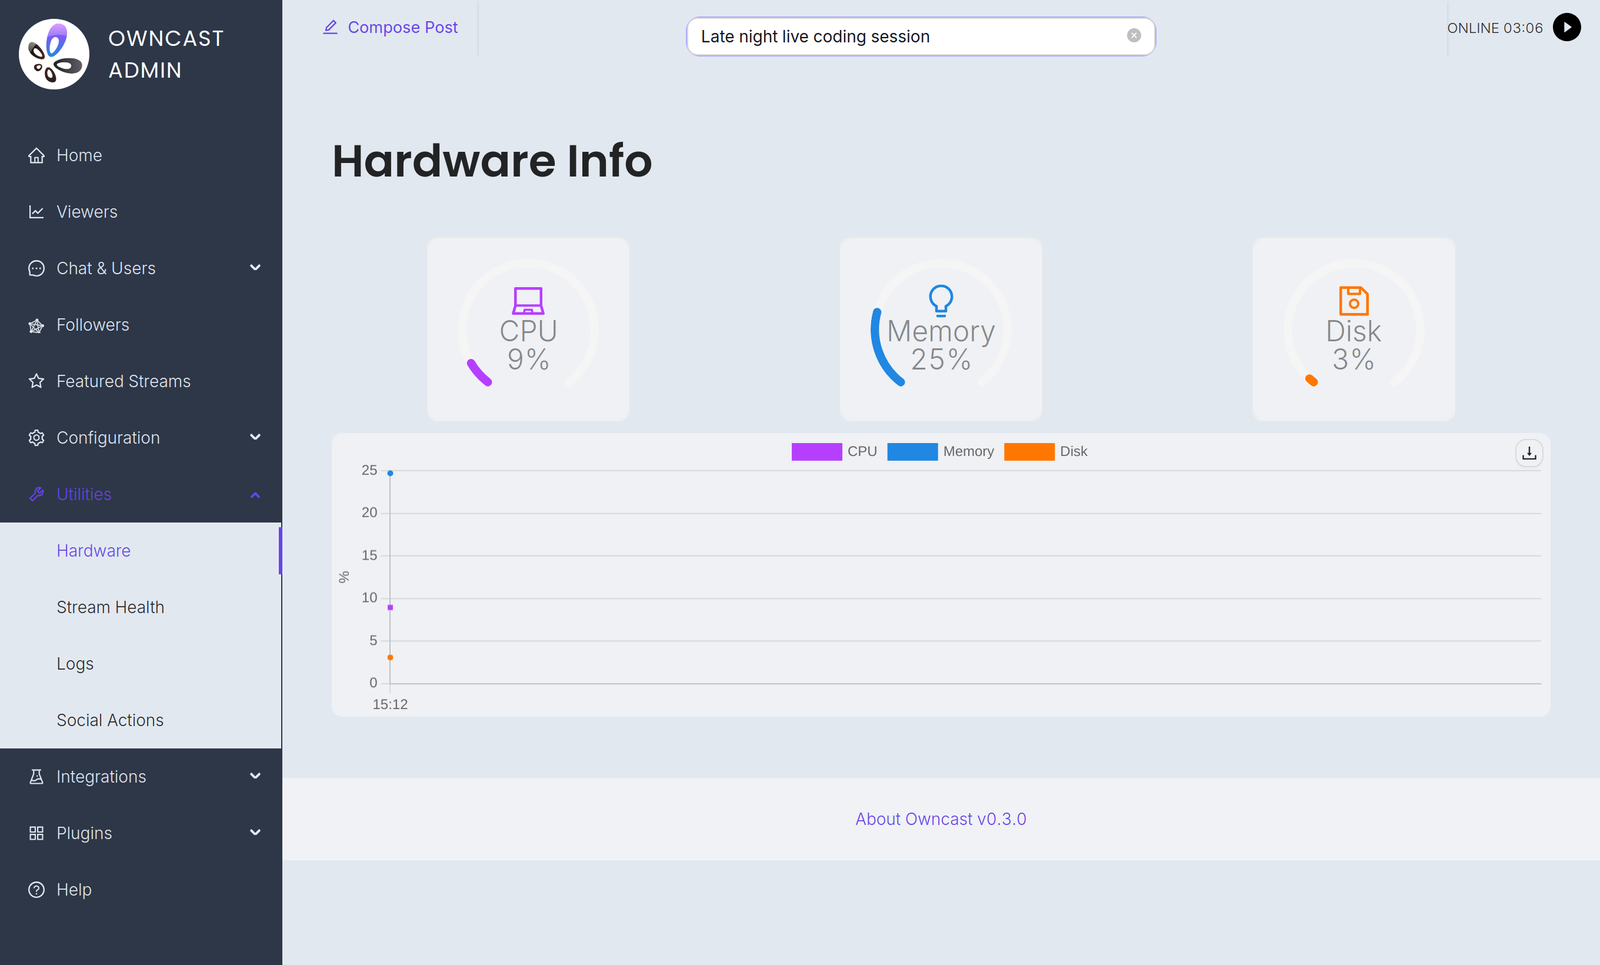
Se você perceber que seu hardware está sendo sobreutilizado, pode querer solucionar problemas.
Prometheus
Para pessoas que preferem usar soluções de monitoramento externas, o Owncast suporta o uso do Prometheus para coletar um conjunto de métricas.
Você pode apontar sua configuração do Prometheus para sua instância do Owncast com o endpoint de /api/admin/prometheus, usando autenticação básica e os dados de login do admin.
Por exemplo:
- job_name: owncast
  scrape_interval: 1m
  metrics_path: /api/admin/prometheus
  scheme: https
  basic_auth:
    username: admin
    password: my_admin_password
  static_configs:
    - targets: ["my.owncast.server"]
Exported metrics
All series are gauges, and all carry two constant labels: version (the Owncast version) and host (your configured server URL, or unknown if it isn't set).
| Name | Meaning |
|---|---|
owncast_instance_active_viewer_count | The number of current viewers. |
owncast_instance_active_chat_client_count | The number of connected chat clients. |
owncast_instance_total_chat_users | The total number of chat users on this Owncast instance. |
owncast_instance_current_chat_message_count | The number of chat messages currently saved before cleanup. |
owncast_instance_playback_error_count | Errors reported by players within the current collection window. |
owncast_instance_cpu_usage | CPU usage as seen internally by Owncast. |
Owncast refreshes these values every 2 minutes, so scraping more frequently than that won't give you more resolution.
Improve this page
See something missing or incorrect? Edit this page and improve the documentation for everyone.
 Gabe Kangas