 Теперь Owncast поддерживает кастомные плагины.
 Производительность потока
Общее состояние потока
Нет смысла в стриме, если никто не может его посмотреть. The Stream Performance page in the admin, at /admin/stream-health, gives you an overview of some important metrics that may give you an idea if what you’re offering your viewers is leading to a good experience.
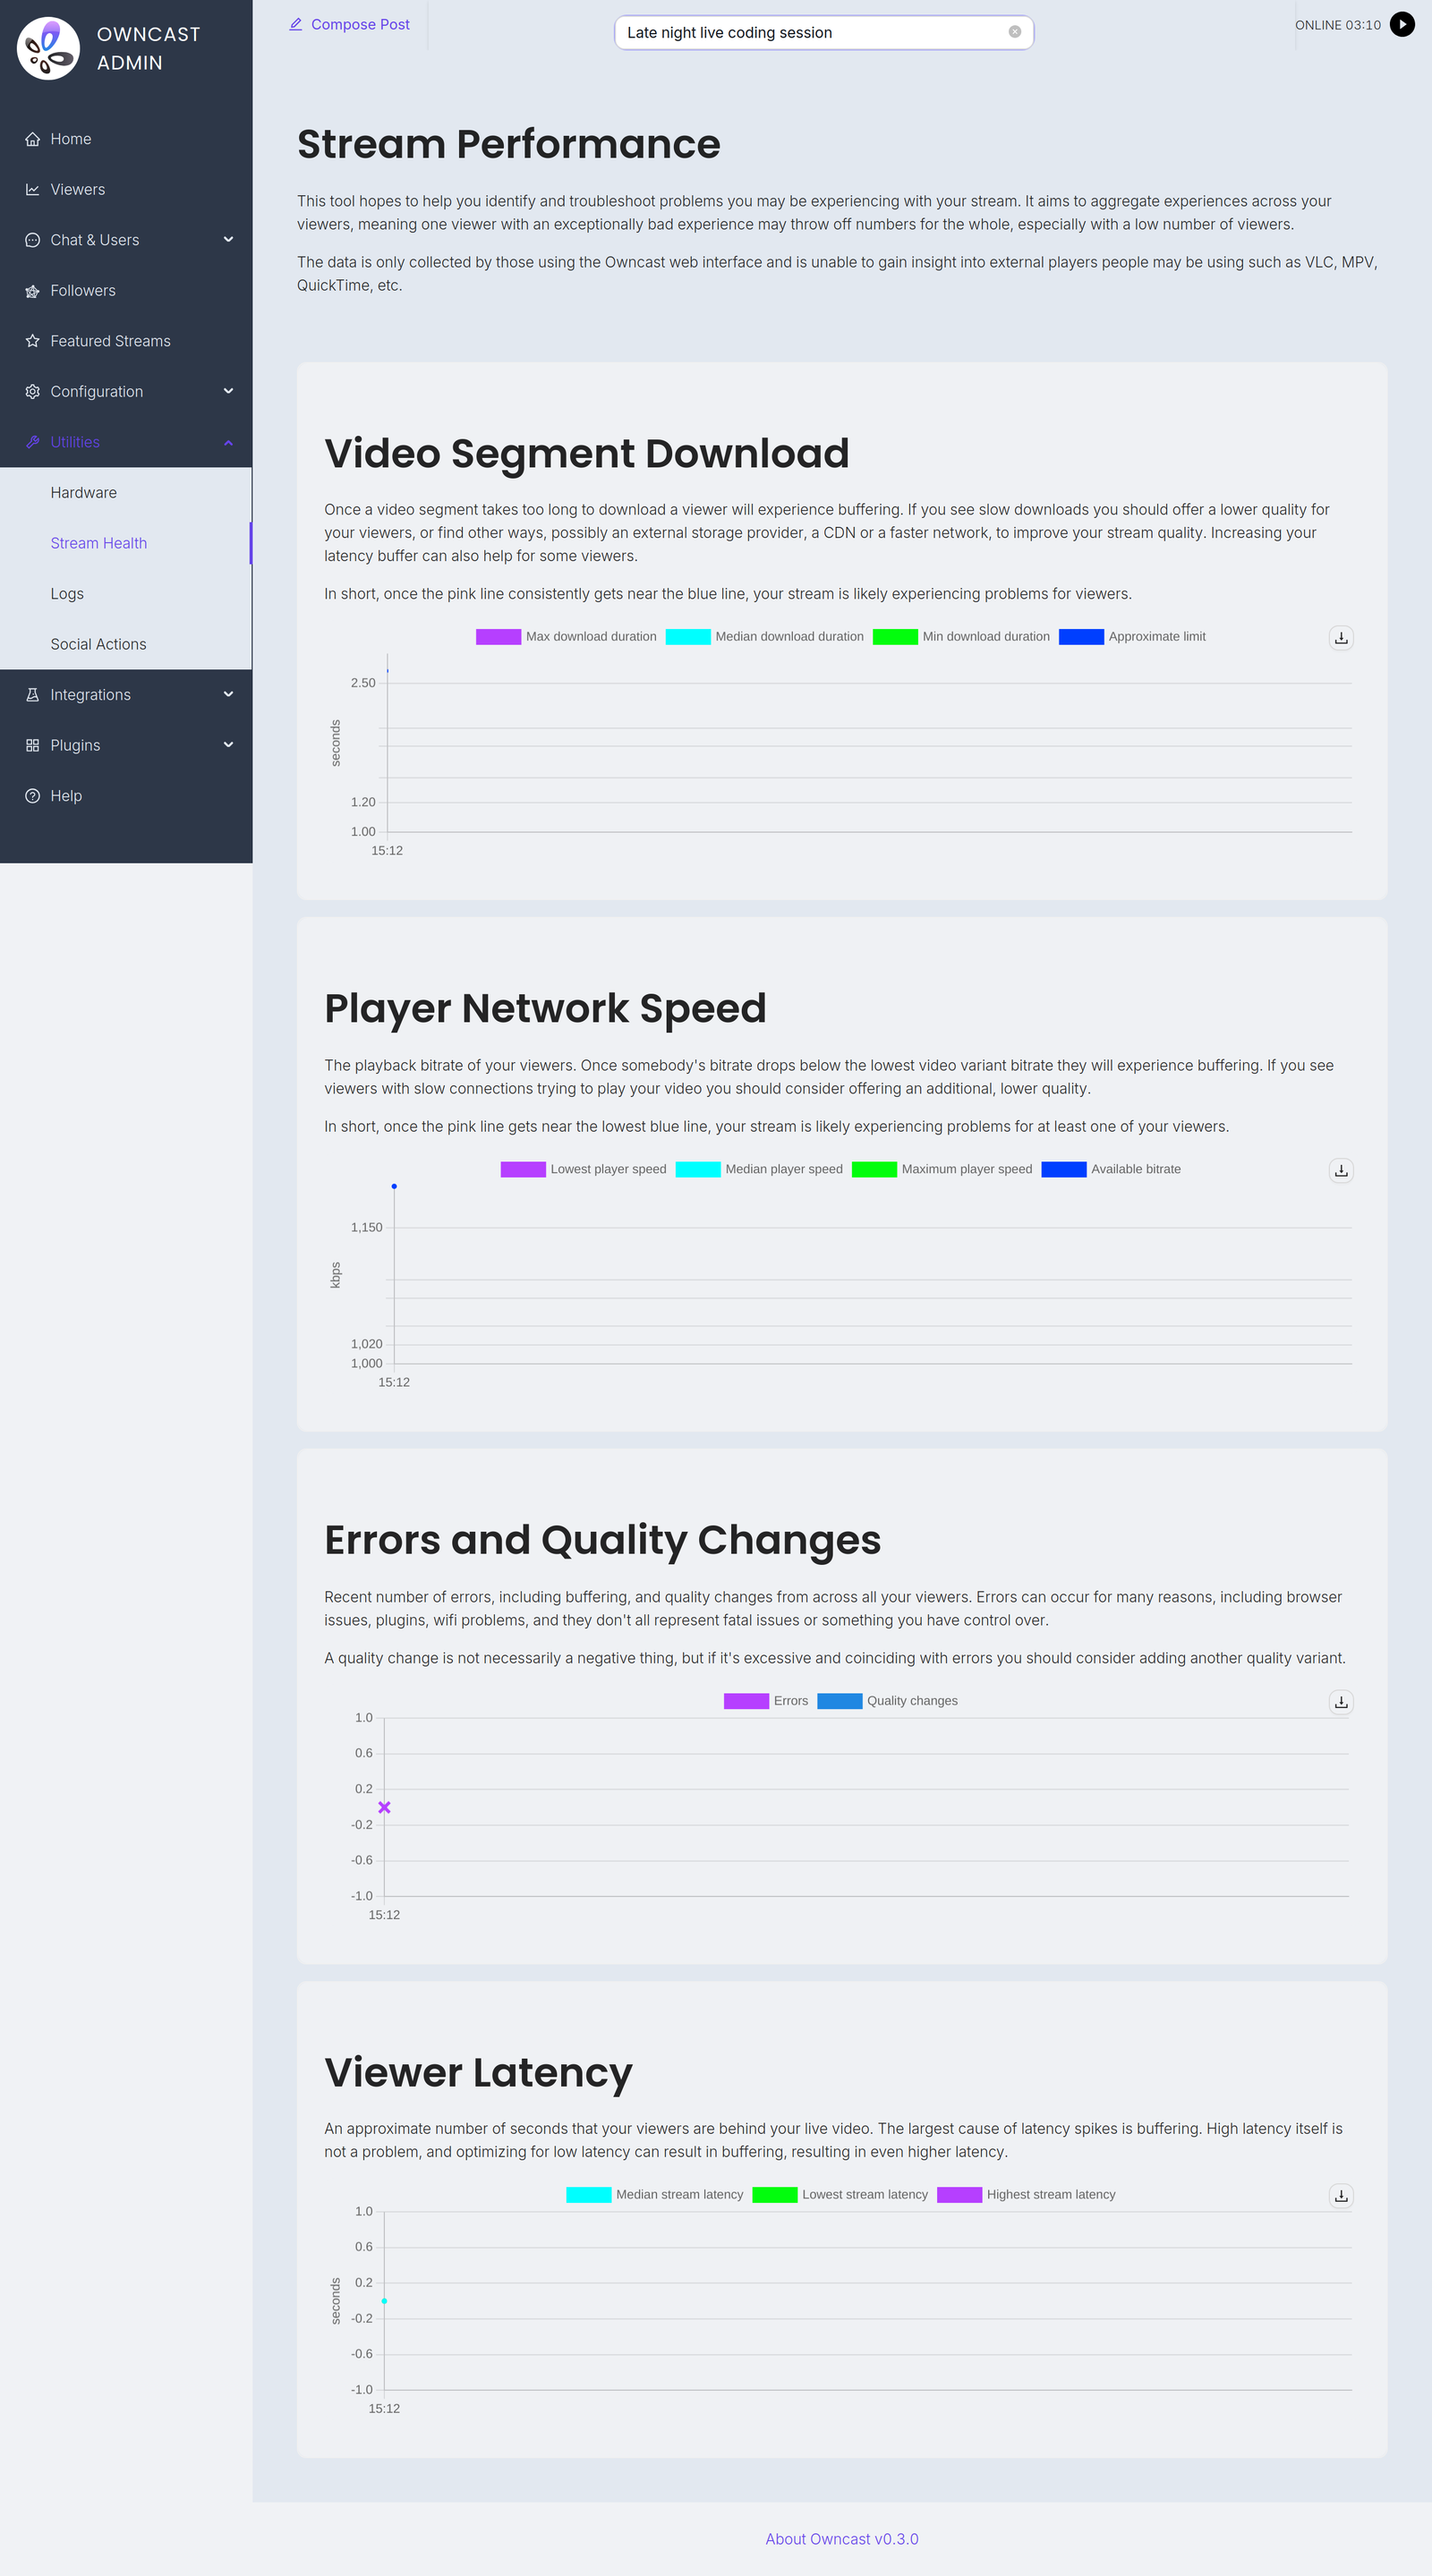
The page charts four things: Video Segment Download, Player Network Speed, Errors and Quality Changes, and Viewer Latency.
Наличие ошибок, низкие скорости сети и чрезмерное время загрузки вашего контента могут означать, что вам нужно добавить дополнительные качества видео, чтобы улучшить производительность воспроизведения для зрителей с низкой пропускной способностью, мобильных сетей или других факторов.
Если вы видите на этой странице, что у людей возникают проблемы с воспроизведением вашего потока, вы можете устранить неполадки.
Note: Only some players report detailed playback metrics themselves, mostly web browsers running the Owncast web interface.
For players that do not self-report, such as VLC, mpv, Safari and ffmpeg, Owncast records the download speed and duration of video segments it serves, as observed by the server. This only works when Owncast serves the video itself. If your segments are hosted on S3 storage, viewers download them from there and these players are not represented in the metrics.
Оборудование
Важно знать, как ваш ЦП, в частности, справляется с задачами обработки видео при устранении неполадок. Owncast предоставляет вам общий обзор ключевых метрик оборудования для помощи в этом.
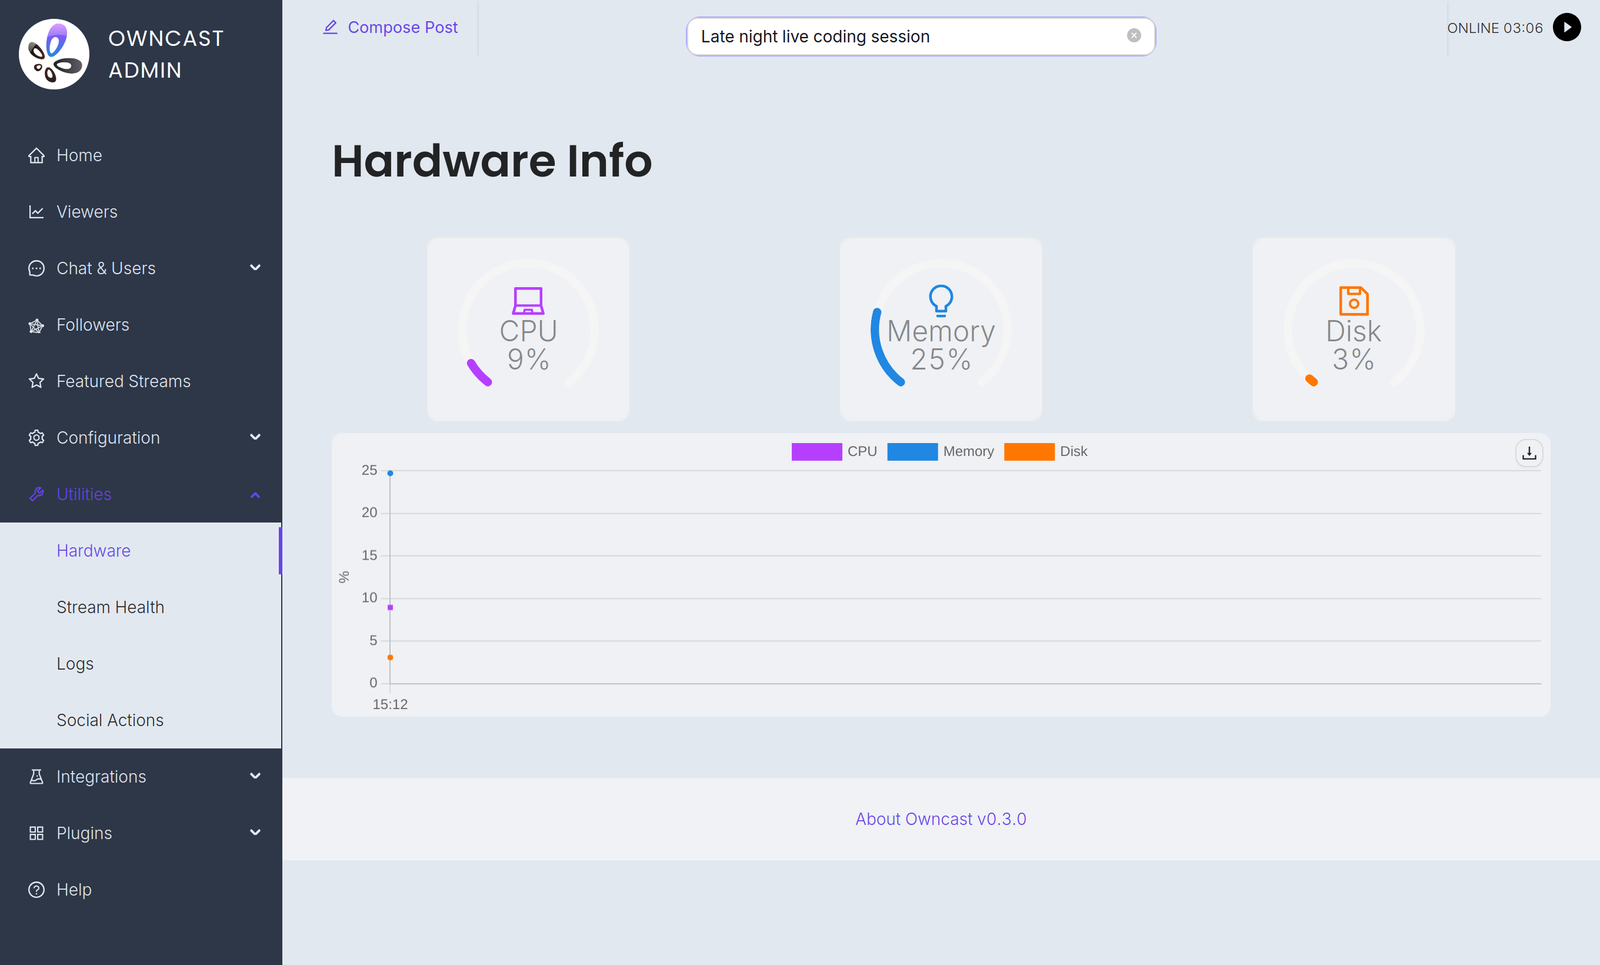
Если вы видите, что ваше оборудование используется слишком активно, вы можете устранить неполадки.
Прометей
Для людей, которые предпочитают использовать внешние решения для мониторинга, Owncast поддерживает использование Prometheus для сбора набора метрик.
Вы можете указать свой конфигурационный файл Prometheus на ваш экземпляр Owncast с конечной точкой /api/admin/prometheus, используя базовую аутентификацию и данные для входа администратора.
Например:
- job_name: owncast
  scrape_interval: 1m
  metrics_path: /api/admin/prometheus
  scheme: https
  basic_auth:
    username: admin
    password: my_admin_password
  static_configs:
    - targets: ["my.owncast.server"]
Exported metrics
All series are gauges, and all carry two constant labels: version (the Owncast version) and host (your configured server URL, or unknown if it isn't set).
| Название | Значение |
|---|---|
owncast_instance_active_viewer_count | Количество текущих зрителей. |
owncast_instance_active_chat_client_count | The number of connected chat clients. |
owncast_instance_total_chat_users | The total number of chat users on this Owncast instance. |
owncast_instance_current_chat_message_count | The number of chat messages currently saved before cleanup. |
owncast_instance_playback_error_count | Errors reported by players within the current collection window. |
owncast_instance_cpu_usage | CPU usage as seen internally by Owncast. |
Owncast refreshes these values every 2 minutes, so scraping more frequently than that won't give you more resolution.
Improve this page
See something missing or incorrect? Edit this page and improve the documentation for everyone.
 Gabe Kangas